


“Broken civic infrastructure is invisible in a budget document. There’s no line item that says the pothole app stopped working. It just shows up as fewer reports, more potholes left, more frustrated residents.”
The Colorado Springs Safety Action Plan is the City’s master to-do list for fixing dangerous roads — which intersections kill people, which corridors have the worst crash records, which signals need retiming, which bike lanes need adding. Ranked, costed, paid for by a federal grant program that hands out money for exactly this kind of work.
It doesn’t fund Colorado Avenue specifically (we covered that funding mix in 011B). This plan is the planning side — the document that decides which corridors get prioritized for the next round of regional-sales-tax money. Yesterday’s episode showed where the bills get paid. Tonight’s shows what gets picked.
In March, the City opened the draft plan for public comment. Standard 21-day window. Anyone could read the document and leave feedback. Except the comment platform was completely broken for the first 7–8 days. The page wouldn’t load. The PDF wouldn’t open. The comment buttons didn’t work. We documented it in real time on March 11th, while it was actively failing — covered originally in Episode 9.
That left residents with roughly 15 functional days to read a 40-page federal road safety plan and respond. The City’s own standard for comparable plans — like the Annual Action Plan for Housing they ran a few months earlier — is 30 days.
We wrote a letter. Polite. Detailed. Documented the platform failures with timestamps. Asked for the comment window to be reopened for an additional 30 days. Copied the City’s accessibility coordinator, because a broken comment platform is also an ADA compliance issue under federal disability law. Sent to Colleen Guillotte, who runs the City’s Traffic Engineering office.
The City wrote back. The response was — let’s call it diplomatic. It thanked us for our interest. It noted the team’s commitment to public engagement. It did not commit to reopening the window. It did not explain what would happen next. Then it went quiet. Still waiting.
Important: the formal comment window is technically closed, but the plan has not been adopted yet. A comment to a planner before adoption is still a comment. Email lands in the same inbox the formal comments would have. Still gets read. Still becomes part of the record.
While we’re on roads. Todd Frisbie has been City Traffic Engineer for seven years. He’s the person who personally pushed for school safety zones to be expanded into middle and high schools last year — which most cities never bother to do — partly because he’s noticed that students of all ages are increasingly getting hit by drivers looking at their phones. He has publicly named distracted driving as the reason for that expansion. So he is already paying attention to the thing we want to ask him about.
The ask, in plain language: review signal timing in high-distraction corridors with the lived reality of distracted drivers as the design baseline, not a hypothetical attentive driver who no longer exists in large enough numbers. An extra half-second on the yellow phase in the right corridors would meaningfully reduce the rate at which distracted drivers run red lights and hit the people who did stop.
Second the request if it matters to you. Same inbox as Colleen: Traffic.Eng@coloradosprings.gov. Be nice. He’s already listening.
The Planning Commission (covered in 011A) set up two drainage studies last week. Tonight: what they actually do.
The first is a drainage basin planning study for the Falcon-Peyton-Ellicott corridor — eastern El Paso County, where most of the County’s growth is happening. The study will figure out where stormwater goes, where it’s supposed to go, where developers can build without making flooding worse, and how much it would cost to fix existing problems.
The second is a countywide stormwater master plan — the bigger-picture version. What infrastructure exists, what’s failing, what’s missing, what needs to be built in the next decade.
Both include a developer fee mechanism: new plats (newly subdivided land) would pay a per-impervious-acre fee to fund stormwater infrastructure on their side of the development. Existing drainage problems in already-built areas remain a public obligation the County has to fund another way — a gap the studies will help quantify.
April 29 · Falcon Library · 2:15–5:15 PM. May 7 · county building · 3:00–5:00 PM. If you live near Falcon, Peyton, or Ellicott — or really anywhere east of Powers — these are the windows when the planning frameworks get shaped before they become rules. Show up if you can.
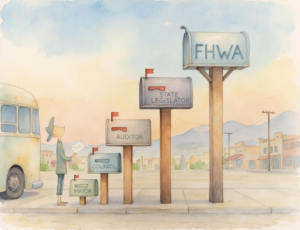
We tested all three official pothole-reporting methods this week.
✓ Phone line — 719-385-ROAD (7623). Voicemail picked up, message left, ticket created. Not the fastest path, but reliable.
✓ Online form — coloradosprings.gov/reportpothole. About 40 seconds. Confirmation email arrived.
✗ GoCOS! app. Login failed twice. Password reset said the email wasn’t on file even though it had been used for a year. App Store reviews from recent weeks confirm a pattern.
Soft data point: 2 of 3 official tools work. The most-promoted one — the app — is the one that doesn’t. The downstream cost is real but invisible in a budget document. No line item says "the pothole app stopped working." It just shows up as fewer reports, more untreated potholes, more frustrated residents.
A lot of what this show does is sit through meetings, read PDFs, and tell you what we found. Useful — but slow, manual, and dependent on us showing up every week. The better version is a dashboard: a page where you can click your address and see what your sales tax went to last quarter, what your mill levy is, which roads are scheduled for repair, which boards have open seats. The numbers from the PDFs — live, searchable, updated as new data comes in.
Four dashboards worth knowing about right now — at cheetochopsticks.com, source on GitHub, free to fork and re-host:
✓ LIVE — Traffic safety dashboard. Built because the City’s road safety plan comment platform was broken. Crash data, corridor danger ratings, the funding pattern — the City is spending roughly 5.6× more on widening roads than on maintaining existing ones — laid out next to the crash data so you can see the gap.
✓ LIVE — Red light camera citation dashboard. 20 automated enforcement intersections across the City. Monthly counts, 2022 through Q1 2026. You can see which intersection generates the most violations, when revenue spiked, and whether the program is actually changing behavior or just collecting fines.
↺ In progress — Crime dashboard. City and County published incident data — types, district breakdowns, year-over-year. Historical depth is shallow because we’re stitching it together from quarterly press releases instead of a clean feed. Fixable, but only with help from inside the building.
↺ In progress — Mortality dashboard. County-level cause-of-death data, age cohorts, year-over-year shifts. Same caveat: we have what’s been published, not what’s been aggregated.
If you work at Colorado Springs Police Department, the Sheriff’s Office, El Paso County Public Health, the Coroner’s Office, or anywhere upstream of this data — and you have access to an aggregate feed we could pull from — please write in. A weekly CSV. A monthly export. An API endpoint. Whatever exists. We’ll handle the integration on our end.
Framing matters here: these people are busy. Genuinely. Ten records requests = ten different staff members each spending an hour pulling data by hand. One aggregate feed = one setup conversation, then the data flows on its own. Same outcome, tiny fraction of the staff time. Respect the labor of the people doing the underlying work.
The goal is simple: build the dashboards, prove they’re useful, then offer them to the City and County. If they want to host themselves — great. If they want us to keep running them — also great. If somebody downloads the repo and runs a better version under a different name — even better. Either way, residents get tools that don’t exist yet.
“One aggregate feed is one setup conversation. Ten records requests is ten different people spending an hour each pulling data by hand. Same outcome. Tiny fraction of the staff time. Respect the labor.”
comment window
broken
days remaining
standard (days)
working
maintenance spend
camera sites
2 live · 2 loading
as Traffic Engineer
Colleen Guillotte · Runs the City’s Traffic Engineering office · recipient of the March extension request · Traffic.Eng@coloradosprings.gov
Todd Frisbie · City Traffic Engineer, 7 years in role · expanded school safety zones into middle and high schools · open letter recipient re: signal timing in high-distraction corridors
Colorado Springs Safety Action Plan · the City’s master to-do list for fixing dangerous roads. Federally funded. Ranks corridors and intersections by crash severity and cost-to-fix. Draft went up for public comment March 2026. Not yet adopted by City Council. Originally covered in Episode 009.
The speeches in local government — Roybal honoring his dispatchers in 011A, Simmons walking through the Q4 numbers in 011B, Frisbie explaining school safety zones — are genuinely good. Warm, specific, human. We’re not trying to replace them.
cheetochopsticks.com is where we’re putting the underlying numbers together for data-driven reference — so you can verify a figure, layer it against other data, or look at it on your own schedule. It’s a work in progress. There are gaps. We’ll keep filling them — faster if you happen to work somewhere upstream and can point us at a feed.
Speeches and spreadsheets do different work. This show tries to help both exist.
✓ LIVE — Traffic safety dashboard. Crash patterns, corridor danger ratings, funding vs crash gap. Built specifically so residents have somewhere to go after the road safety plan comment platform failed.
✓ LIVE — Red light camera citations. 20 intersections · 2022–Q1 2026 · monthly counts · revenue and behavior trends.
↺ In progress — Crime dashboard. Types, district breakdowns, year-over-year. Historical depth is shallow; needs clean feed from CSPD or the Sheriff’s Office.
↺ In progress — Mortality dashboard. Cause-of-death by age cohort, county-level. Needs aggregate feed from EPC Public Health or the Coroner’s Office.
cheetochopsticks.com · source on GitHub · free to fork, re-skin, re-host.
- Road safety plan: Retiring the acronym. 21-day comment window cut to ~15 by broken platform. City’s own standard is 30. Extension request got a vague answer. Plan not yet adopted. Comments still land.
- Open letter to Todd Frisbie: 7 years in role, already paying attention to distracted driving. Polite ask: review signal timing with distracted drivers as design baseline.
- Two drainage meetings: Apr 29 Falcon Library 2:15–5:15 · May 7 county building 3:00–5:00. Developer fee mechanism baked in. Show up.
- Pothole test: 2 of 3 tools work. Phone line ✓ · web form ✓ · GoCOS! app ✗.
- Dashboards: 2 live (traffic safety, red-light cameras), 2 loading (crime, mortality). Source on GitHub. Aggregate feeds needed.
- The three-pack is done. Get home safe.
1 — The Road Safety Plan
The City calls it COSSAP. Retire the acronym. It’s the master to-do list for fixing dangerous roads — ranked, costed, federally funded. Not the funding source for Colorado Avenue specifically (that was 011B), but the document that picks which corridors get prioritized next. In March 2026 the City opened a 21-day public comment window. The platform was broken for the first 7–8 days. Residents got roughly 15 functional days to read a 40-page federal plan. The City’s own comparable-plan standard is 30 days. We filed a polite, documented extension request to Colleen Guillotte. The response was diplomatic and uncommitted. It’s been quiet since. But the plan has not been adopted yet — comments still land.
2 — An Open Letter to Todd Frisbie
Todd Frisbie, City Traffic Engineer, 7 years in the role. Already pushed school safety zones into middle and high schools, already publicly named distracted driving as the reason. Already listening. The polite ask: take another pass through the signal timing manual with distracted drivers as the design baseline, not a hypothetical attentive driver. Even an extra half-second on the yellow phase in the right corridors would reduce red-light running and the crashes that come with it. Same inbox as Colleen: Traffic.Eng@coloradosprings.gov.
3 — Drainage Meetings
Two studies set up by the Planning Commission. Apr 29 · Falcon Library · 2:15–5:15 PM — Falcon-Peyton-Ellicott basin planning. May 7 · county building · 3:00–5:00 PM — countywide stormwater master plan. Both include a per-impervious-acre developer fee for new plats to fund stormwater infrastructure on the developer side. Existing drainage problems in already-built areas remain a public obligation — and that gap is part of what the studies are meant to quantify. If you live east of Powers, especially near Falcon, Peyton, or Ellicott, these are the windows where planning frameworks get shaped before they become rules. After the rules are written, they’re much harder to change.
4 — The Pothole Experiment
Three official reporting methods, tested this week. The phone line (719-385-ROAD) works. The web form (coloradosprings.gov/reportpothole) works. The GoCOS! app does not — login fails, password reset rejects known emails. App Store reviews confirm a pattern. The most-promoted tool is the one that doesn’t work, and this kind of broken civic infrastructure is invisible in a budget document. No line item tracks it. It just shows up as fewer reports and more untreated potholes.
5 — Four Dashboards
Two live at cheetochopsticks.com: the traffic safety dashboard (crash data, corridor ratings, the 5.6× widening-vs-maintenance spending gap) and the red-light camera dashboard (20 intersections, 2022–Q1 2026). Two loading: the crime dashboard and the mortality dashboard, both stitched from what’s been published publicly rather than a clean aggregate feed. Source on GitHub. Free to fork, re-skin, re-host.
6 — Open Ask
If you work at CSPD, the Sheriff’s Office, EPC Public Health, the Coroner’s Office, or anywhere upstream of this data — and you have access to an aggregate feed we could pull from — please write in. One aggregate feed = one setup conversation and then the data flows on its own. Ten records requests = ten staff members spending an hour each pulling data by hand. Respect the labor of the people doing the underlying work.
You’ve got plenty to mention at dinner. Pace yourself. Pick one.
You don’t have to solve anything. Staying aware is enough. If you’d like a small way to help someone directly, there’s a community resource card at Pivot True North. Download, print a few copies, keep them in your car. If you see someone who might need one, just leave it. No speech required.
And if you want something even simpler — pick up one piece of trash on your way inside. Half a million people, one piece each, half a million pieces gone before sunset. Small things scale quickly.
If something here stuck with you, that’s probably your lane.
Either way, thanks for listening. I’ll read the paperwork again next week. You just get home safe.