


The Kitchen Table
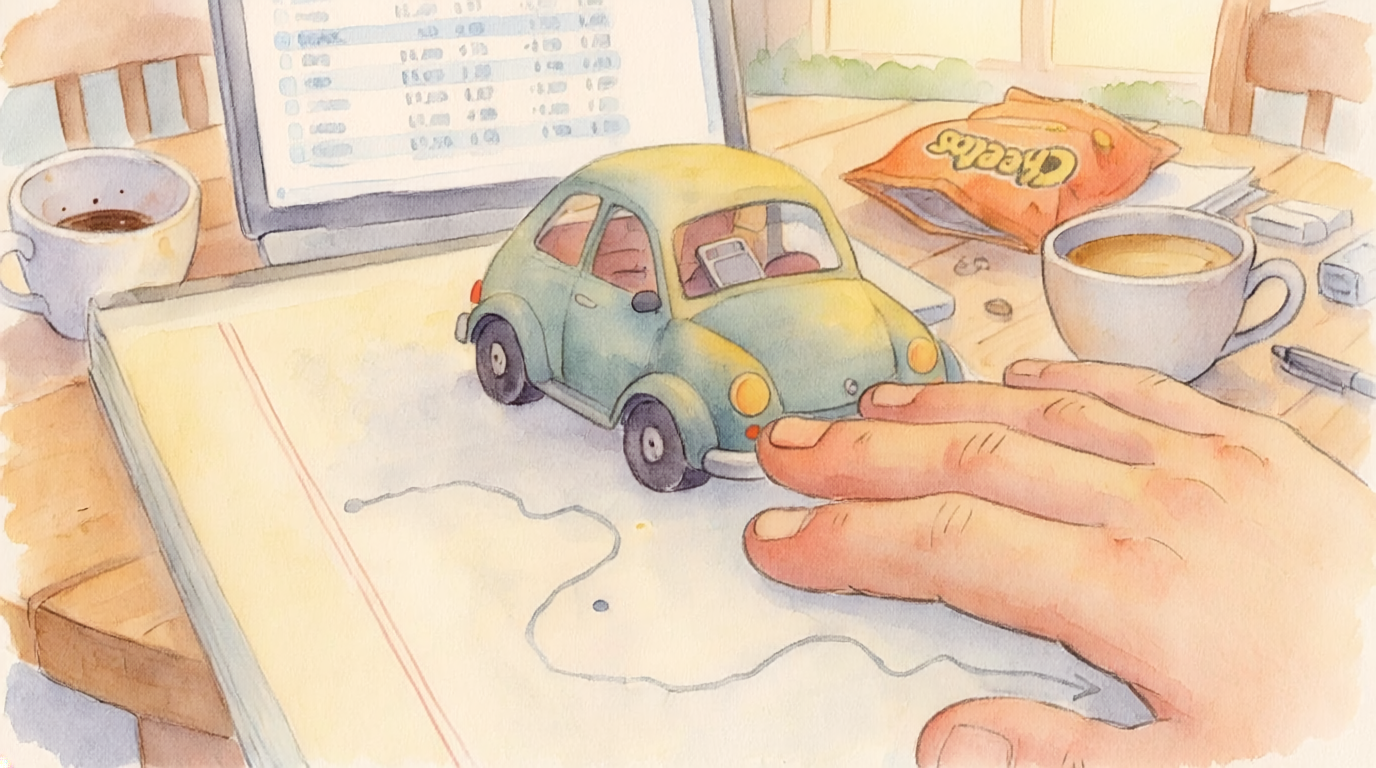
Before the chopsticks. Before the five commissioners. Before the name of Ambrocius Bodacious Bocephus was entered permanently into an El Paso County public record — there was a kitchen table.
No whiteboard. No color-coded timeline. No organizational chart mapping the seventeen stakeholder agencies that contributed to the Colorado Springs Safety Action Plan. Just a laptop that needed to be plugged in — the battery had been unreliable since approximately 2022 — and a legal pad belonging to ABB, and two people sitting across from each other with the specific expression of people who might be onto something or might be about to waste an afternoon. The expressions were identical and gave no information either way.
And a phone. Face up on the table. Waiting for USAA to call back about the car insurance claim that had been in process for eleven days and was supposed to be resolved by end of week.
If USAA had called back on time, they would not have been sitting there.
The Map with the Colored Dots
They started where the city told them to start. The crash data dashboard — embedded on the Safety Action Plan page, built with ArcGIS, the official public interface for the data underpinning the entire plan.
Brannon opened it.
Colored dots on a map. Many colored dots.
They looked at it. They looked at each other. They looked back at it.
The dots were color-coded. Different colors meant different things. The legend existed somewhere. Finding it required a specific sequence of interactions that the interface did not announce and did not explain. ABB picked up his pen. Put it back down. Picked it up again.
Not a question exactly. More like something that escaped before he could stop it.
Brannon zoomed in on a cluster of dots near Academy Boulevard. Zoomed back out. Tried clicking one. Something happened but not something useful. The interface required a mouse, functioning color vision, and a specific kind of spatial literacy that neither of them had been trained in and the interface was not offering to teach.
They looked at the Safety Action Plan's own analytical framework — the city's danger rating system for each road corridor, the standard by which the plan prioritized where to intervene. Then they looked back at the dashboard.
Colored dots. No danger ratings. No road segment categorization. No way to tell which corridors the city rated most dangerous and which it rated least. The map showed where crashes happened. The plan needed to know why, and how severely. Those were different questions. The map answered one of them incompletely and the other one not at all.
That's Pueblo
The Colorado Department of Transportation publishes crash data. Annual files, 2007 through 2025. Every recorded crash in the state. Every variable — road condition, lighting, time of day, crash type, severity, location, contributing factors. All of it. Public. Downloadable. Free. No map. No colored dots. Just numbers.
Brannon started pulling it into something readable. ABB worked the legal pad. They were not fast. They were not slick. They made mistakes and backed up and tried differently. At one point Brannon accidentally filtered for crashes in a completely different county and they spent four minutes wondering why everything looked different before ABB noticed.
Brannon looked at the screen. Looked at ABB. Looked back at the screen.
"The numbers made a lot more sense now actually," he said.
He fixed the filter. They continued.
This is what civic data work actually looks like. Not a montage. Not a breakthrough with a musical sting. Two people at a kitchen table doing something slightly outside their comfort zone because nobody else was doing it, it needed doing, they were there, and USAA had not called back.
Gradually the numbers began to resolve. Not dramatically — the way a photograph develops. Slowly, then all at once, the image becoming itself without announcing the moment it became clear. ABB's pen moved steadily across the legal pad. Brannon scrolled, filtered, sorted, scrolled again. Numbers becoming patterns becoming something that almost looked like an answer.
The ADA Moment
At some point ABB looked up from the legal pad. He had been thinking about the dashboard — the colored dots, the interface that required a mouse and functioning color vision and a spatial literacy it wasn't offering to teach.
"We should check the page itself," he said. "Not just what's in it. The page."
Brannon opened Chrome. Opened the WAVE accessibility extension — free, runs in the browser, requires clicking one button and reading what comes back. He ran it on the city's Safety Action Plan page.
Thirty seconds.
Four failures. Listed. Named. Explained. Each one with a plain-language description of what was wrong and what needed to change. He ran it on the CDOT crash data download page. Five failures.
Total time, including reading the results: twelve minutes.
"For a $350,000 project," Brannon said.
Not accusatory. The way you note that the parking meter has expired.
They sat with that for a moment.
"We used a free browser extension," ABB said. "And a checklist."
"The city could have done this before the page went live," he said.
"Yes," said Brannon.
They went back to the crash data.
Why Does the City Need ArcGIS
It arrived the way things arrive when you've been looking at something long enough. Not planned. Brannon looked at the ArcGIS dashboard, looked at what they were building, and said it out loud before he'd fully decided to.
"Why does the city need ArcGIS for this."
ABB looked up.
Brannon kept going. The Google Maps API — free up to usage limits. Custom data overlays. Crash locations from the raw CDOT numbers. Filterable by zip code. Linked to the city's own danger ratings for each corridor when that data becomes available. Accessible. Keyboard navigable. Screen reader compatible. An afternoon of development work. No license fee. No contract renewal. No colored dots requiring color vision to interpret.
ABB wrote it all down on the legal pad, then looked up.
"We're already building something," he said.
"Right," said Brannon. He stopped. Looked at the screen. "Right."
They went back to the numbers.
The Forest Gump Moment
It wasn't dramatic when it happened. More like the moment you realize you've been holding your breath.
Brannon stopped scrolling. He looked at the numbers. ABB was already looking at him.
88% of crashes on dry roads. 70% in daylight. 31% rear-end collisions. Serious injuries rising 75% between 2020 and 2024 while total crashes declined — meaning each crash was hitting harder, not more often. The roads were getting more dangerous per crash. Not more crashes. Worse crashes. Low impairment numbers. Low weather-related numbers. Normal lighting conditions in most cases.
"Is that it?" ABB said.
Brannon scrolled up. Scrolled back down. Filtered differently. Got the same shape.
"…I think that's it."
They sat with it. The specific quiet of two people who expected a maze and found a hallway. Then, slowly, they talked it through — the way two people do when they're still making sure they haven't missed something obvious:
People are looking at their phones. On a sunny day. Dry road. Full speed. And the light changes. Maybe a little fast. Or just fast enough that if you're not paying attention — you don't stop in time. And you hit the person in front of you. Hard. Because you were going full speed. Because the road was dry. Because conditions were perfect. Except for the phone.
"That's it."
ABB picked up his pen. Wrote one word: Signal. Looked at it. Wrote two more: Road surface. Then kept writing — something smaller underneath, angling the legal pad slightly away from Brannon.
Brannon leaned forward. ABB covered it with his hand.
"Are you doodling," Brannon said.
A pause. The specific beat of a man who is absolutely doodling and has been caught and is deciding how to handle this.
"…it's a diagram," ABB said. "Of the problem."
"We already solved the problem."
"It's a diagram of the solved problem."
Brannon looked at him.
"That's a doodle," Brannon said.
ABB said nothing. Picked up the pen. Started writing on a fresh page. Where Brannon could see it.
Productive Waiting
ABB looked at the fresh page. At everything they had. Signal. Road surface. Map doesn't match the plan. Forty-five minutes. Google Maps. Free. A diagram of the solved problem on a separate page.
"How did we end up here," he said. Not philosophically. More like a man trying to retrace his steps after finding his keys in the freezer.
"USAA," said Brannon.
"Right."
A pause.
"Productive waiting," Ambrocius Bodacious Bocephus said. "We had a little time."
"Why not," said Brannon.
They both looked at the phone. USAA not calling. The afternoon still available.
"Life is simple," ABB said. "Not easy. Simple."
"Do you want to present it?" Brannon asked.
ABB looked at the legal pad. Then at the diagram page. Then back at the legal pad.
"Yeah," he said.
What the Numbers Resolved Into
The CDOT crash data covers every recorded crash in Colorado, 2007 through 2025. Brannon and ABB pulled eight years of El Paso County data. Filtered it, sorted it, accidentally looked at Pueblo for four minutes, corrected it, and kept going until a pattern became visible. Here's the shape it made.
The pattern points in one direction. People are looking at their phones on a clear road at speed. The signal switches — maybe a quarter second faster than the distracted brain can process it — and the car in front stops and the car behind doesn't. The conditions were perfect. Except for the phone. Except for the timing.
The city's Safety Action Plan uses a danger rating system to identify which corridors need priority intervention. Brannon and ABB found that the public-facing ArcGIS dashboard doesn't reflect those danger ratings — you can see where crashes cluster, but not which roads the city itself considers most urgent. Those are different questions. The map answers one of them incompletely and the other one not at all.
If the plan's spending priorities don't follow the danger ratings, the plan isn't following its own diagnosis. That's the question Episode Seven puts on the record.
The Accessibility Audit
They used the WAVE browser extension — free, one button, available to anyone with Chrome or Firefox. They ran it on the city's Safety Action Plan page and the CDOT crash data download page. Twelve minutes total, including reading the results.
"For a $350,000 project," Brannon said. Not accusatory. Just factual.
The issues were listed, named, and explained in plain language. Each one comes with a description of what's wrong and what needs to change. Residents using screen readers, keyboard navigation, or other assistive technology cannot fully use the crash interface the city published as the official public window into the plan's data. The DOJ's Title II ADA final rule sets a WCAG 2.1 AA compliance deadline of April 24, 2026 for Colorado Springs.
What the Map Could Actually Be
The city's crash dashboard runs on ArcGIS — a licensed platform with a recurring contract cost. Brannon's observation at the kitchen table: the Google Maps API is free up to usage limits, supports custom data overlays, is accessible, keyboard-navigable, and screen reader compatible. An afternoon of development work. No license fee.
Brannon and ABB built this. The dashboard they offer to the city pulls from the same raw CDOT data, displays crash locations with plain-language filters, and meets WCAG 2.1 AA standards. The city can have it at no cost. That's what "no invoice" means.
You Have A Little Time
Brannon and ABB are not experts. They said so themselves. They had a laptop, a legal pad, a free browser extension, and a USAA hold queue buying them an afternoon. The tools they used are available to anyone. The data they used is public.
Here's what you can do with the same amount of time — or less.
Install the WAVE Web Accessibility Evaluation Tool in Chrome or Firefox. Free. One click per page. Run it on the city's Safety Action Plan page and the CDOT crash data page. Read what comes back. The DOJ's Title II ADA final rule sets a WCAG 2.1 AA compliance deadline of April 24, 2026 for Colorado Springs. If you find something worth sharing, send it to us — more people looking at public tools is how public tools get better.
The Colorado Department of Transportation publishes annual crash files — 2007 through 2025, every recorded crash in the state. Public. Downloadable. Free. Filter for El Paso County. You don't need to be a data scientist. You need a spreadsheet and a few hours. The pattern is not subtle once you're looking at it.
The city is using ArcGIS — a licensed, recurring-cost platform — for a public-facing crash dashboard that fails accessibility standards and doesn't display the danger ratings the plan is built on. The Google Maps API is free up to usage limits and can do the same job accessibly. It is reasonable to ask what the contract costs, and whether a free alternative was considered.
Brannon and ABB built a replacement dashboard using public CDOT data, the Google Maps API, and WCAG 2.1 AA standards. Accessible, searchable by zip code, plain language. They offered it to the city at the hearing. No invoice. Before the plan is adopted in May, it's worth the city being on the record about whether they'll use it.
The DOJ's Title II ADA final rule sets a WCAG 2.1 AA compliance deadline of April 24, 2026 for Colorado Springs. If you encountered a barrier on those pages — a tool that didn't work with your assistive technology, an interface that required a mouse — you can file a complaint with the DOJ. Free. About 30 minutes. No lawyer required. The DOJ reaches out to the city and the city has an opportunity to respond and address the issue. It's a process designed to help, not punish.
Questions You Can Ask Tonight
These questions put specific, documented findings on the public record. You don't need to know the answer. You need the answer — or the absence of one — on tape. Pick one. One is enough.
Tap any question to copy it to your clipboard.
The Rooms Before May
The Transportation Safety Action Plan adoption vote is targeted for May 2026. Before it happens, there are public rooms where you can be on the record. All of them accept written comment. All of them are recorded. Most of the time, they are nearly empty.
City Transportation (Traffic Engineering): trafficengineering@coloradosprings.gov · 719-385-7433
Colorado Springs City Clerk: cityclerk@coloradosprings.gov · 719-385-1687
City Council: coloradosprings.gov/city-council
ADA Compliance (El Paso County — David Mejia): dmejia@elpasoco.com · 719-520-6866
BOCC Clerk: boccclerk@elpasoco.com · 719-520-7276
Open Records (Mike Madsen): mmadsen@elpasoco.com · 719-520-6403
DOJ ADA Complaint (digital accessibility): ada.gov/file-a-complaint
WAVE Accessibility Tool (free): wave.webaim.org
CDOT Crash Data (public, free): codot.gov/safety/crash-data
Colorado FOIC (CORA disputes): coloradofoic.org
State legislator lookup: leg.colorado.gov/find-my-legislator
Send Us What You Find
Run the WAVE check and find something worth sharing? Pull the CDOT data and get an interesting number? Submit a comment to City Council and hear back? We'd love to know what you found.
Send it to us. The data is public. The tools are free. The afternoon is available.
We dig from our end. You dig from yours. Episode Seven is Friday Night — what happens when they take the kitchen table to the right rooms. We'll see you there.
"Life is simple. Not easy. Simple."